The Supabase dashboard has become more feature-rich in the last month. We have a powerful SQL editor backed by Monaco. We built an Airtable-like view of your database, making editing a breeze.
Features, performance, DX - choose three
Performance can quickly regress when adding new features, especially in a Single Page Application. Here are the steps we took to guarantee a good baseline performance within our application, without compromising on the developer experience (DX).
Establishing a baseline and setting targets
You can't fix what you can't measure
There was some low-hanging fruit to improve performance, but we had one important thing to do before that - establish a baseline.
Our dashboard is JavaScript heavy, so we started by setting up analytics to track our bundle sizes. Next-bundle-analyzer (or webpack-bundle-analyzer) provides an interactive treemap of your generated JavaScript bundles. This is our treemap when we started. It gave us a clear indication what changes we needed to achieve the most impact.

There are some great tools when it comes to Real User Monitoring (RUM). We chose the newly-launched Sentry performance monitoring product since we already use Sentry for error tracking and we wanted to minimize new tools in our stack. It also supports reporting Core Web Vitals, the performance metrics created by Google to track initial loading performance, responsiveness and visual stability. Core Web Vitals come with recommended target values, giving us clear goals to hit.

Improving our JavaScript bundle size
How to not load the entire npm registry into our user's browsers
Choosing smaller modules
We used Bundlephobia on our largest modules. This is a great website to have in your JS-performance arsenal. It gives the size of npm modules across different versions and recommends alternate modules with similar functionality which are smaller.
Moment.js is notorious for its large bundle size and we don't need complex date processing for our dashboard. It was straightforward to switch to day-js which is largely API-compatible with Moment.js. This change reduced our gzipped bundle size by 68 KB.
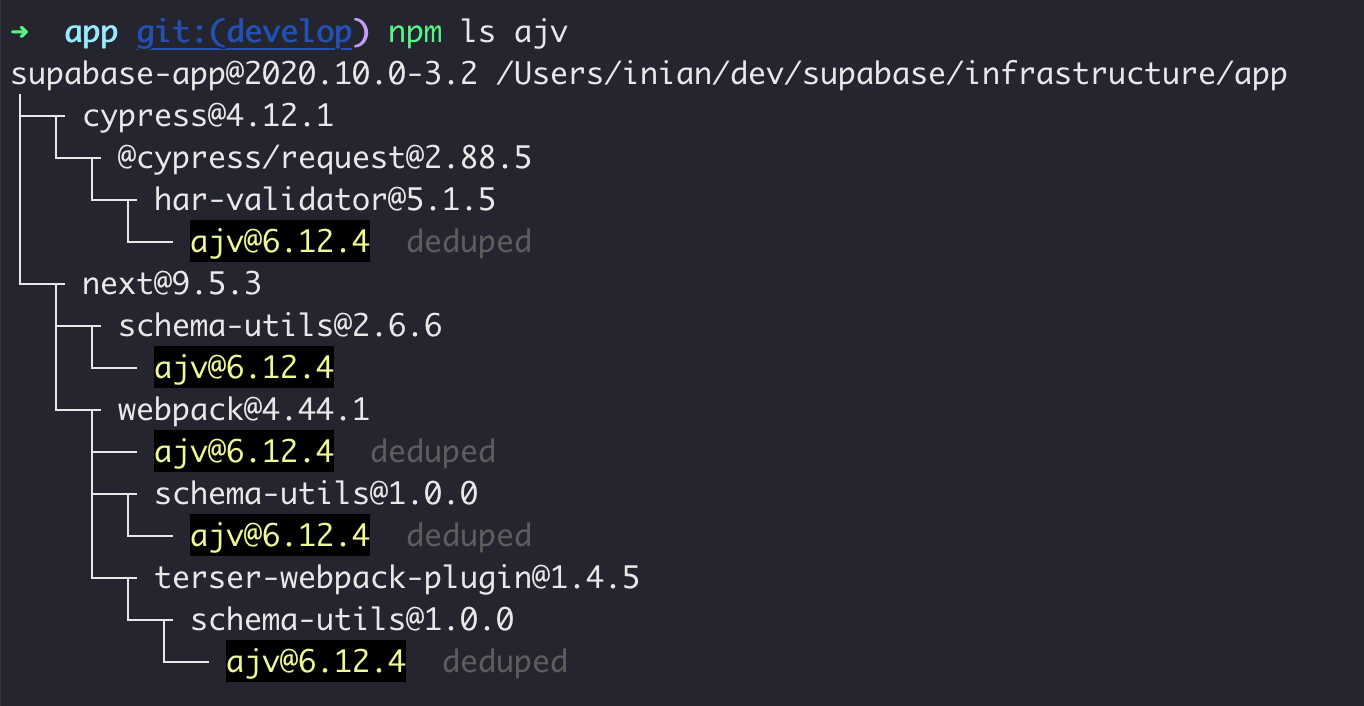
We migrated from Joi to ajv for our schema validation which was 32% smaller. ajv was already bundled as a transitive dependency of other modules, making it a no-brainer.

We reverted our crypto-js module from version 4.0 to 3.3.0. Version 4.0 injects more than 400kb code when used in a browser context. The newer version replaces Math.random with node's implementation, injecting the entire node crypto module into the browser context. We use crypto-js for decrypting user's API keys and so we're not reliant on the randomness of the PRNG. We might move to a dedicated module like aes-js in the future since it has a much smaller surface area than crypto-js (in terms of security and performance).
Using partial imports
By selectively importing functions from modules like lodash, we cut the gzipped size by another 40kb across all our bundles.
1// before 2import _ from 'lodash'\n 3// maunally cherry picking modules 4import find from 'lodash/find' 5import debounce from 'lodash/debounce'\n 6// using babel-plugin-lodash 7import { find, debounce } from 'lodash' 8
In the above example, we added babel-plugin-lodash to our babel configuration which cherry picks the exact lodash functions we import. This makes it easier to import from lodash without cluttering the code with selective import statements.
Moving complex logic to the server
Thanks to some skilled haxors (well, weak passwords mainly) we had crypto miners running on some of our customer's databases. To prevent this, we enforce password strength with the zxcvbn module. Though it improved our overall security, the module is pretty big, weighing in at 388kb gzipped. To get around this, we moved the password-strength checking logic to an API. Now, the frontend queries a server with a user-supplied password and the server computes its strength. This eliminates the module from the frontend.
Lazy loading code
xlsx is another complex and large module, which is used to import spreadsheets into tables. We contemplated moving this logic to the backend, but we found another solution: lazy loading it.
The spreadsheet import is triggered when the user is creating a new table. However the code was previously loaded every time the page was visited - even when a new table was not being created. This made it a good candidate for lazy loading. Using Next.js dynamic imports we are able to load this component (313 kb brotlied) dynamically, whenever the user clicks the "Add content" button.
We use the same technique to lazy load some Lottie animations which are relatively large.
Using native browser APIs
We decided against supporting IE11, opening up more avenues for optimization. Using native browser APIs enabled us to drop even more dependencies. For example, since the fetch API is available in all the browsers we care about, we removed axios and built a simple wrapper using the native fetch API.
Improving Vercel's default caching
The fastest request is the request not made
We noticed that Vercel was sending a Cache-Control header of public, max-age=0, must-revalidate , preventing some of our SVG, CSS and font files from being cached in the browser.
We updated our next.config.js , adding a long max-age to the caching header that Vercel sends. Our assets are versioned properly, so we were able to safely do this.
Enabling Next.js Automatic Static Optimization
Next.js is able to automatically pre-render a page to HTML, whenever a page meets some pre-conditions. This mode is called Automatic Static Optimization. Pre-rendered pages can be cached on a CDN for extremely fast page loads. We removed calls to getServerSideProps and getInitialProps to take advantage of this mode.
Developing a performance culture
Always in sight, always in mind
Our performance optimization journey will never be complete. It requires constant vigilance to maintain a baseline across our users. To instill this within our team, we took a few actions.
We developed a Slack bot which sends our Sentry performance dashboard every week, containing our slowest transactions and our Core Web Vitals summary. This shows which pages need improvement and where our users are the most miserable.
During our transition from Alpha to Beta, performance was one of the important features, along with stability and security. We considered performance implications while choosing libraries and tools. Having a "seat at the table" in these discussions ensures that performance is not considered as an after-thought.
Results
With these changes, we have a respectable Core Web Vitals score. This is a snapshot from Sentry with RUM data from the last week. We are within the recommended threshold for all the 3 Web Vitals.

Our Next.js build output also shows that users download < 200 kb of JavaScript between any two page transitions. We're still improving too - even though we provide a lot of functionality in our dashboard, we will continue to reduce our bundle sizes.
Things that did not work
You win some, you lose some
We tried a VSCode plugin called Import cost which shows the size of JavaScript modules when you import it in your editor. However, the plugin did not work on our codebase since it doesn't support some JavaScript features, like optional chaining.
We also passed on using lodash-webpack-plugin even though it had the potential to reduce our JavaScript sizes, because it could potentially break our code if not used carefully. This plugin would require our frontend team to understand the Webpack configuration, updating it whenever they use a new lodash feature set.
The road ahead
Our broad goal is to implement best practices for frontend performance, and make it exciting to all of our team. These are some ideas we have on our roadmap -
- Set up Lighthouse in a GitHub Action to catch performance regression earlier in the development life cycle.
- Continue reducing our initial JavaScript payload size, to improve our LCP time
- Explore
cloud-modein Segment which makes API calls from the server instead of loading third-party library on the browser.
Reach out to us on Twitter if you have more ideas to speed up our website ⚡